Analyze running performance and time consumption of beego with golang pprof
Go has a package name pprof that we can use directly to analyze the performance of go app, include beego.
The report of pprof tells will tell us CPU cost, Memory cost, Time (CPU) cost an so on.
1 Turn on pprof
- Add a new controller to collect analyze data:
package analyze

import (
    "github.com/astaxie/beego"
    "net/http/pprof"
)

type ProfController struct {
    beego.Controller
}

func (c *ProfController) Get() {
    switch c.Ctx.Input.Param(":app") {
    default:
        pprof.Index(c.Ctx.ResponseWriter, c.Ctx.Request)
    case "":
        pprof.Index(c.Ctx.ResponseWriter, c.Ctx.Request)
    case "cmdline":
        pprof.Cmdline(c.Ctx.ResponseWriter, c.Ctx.Request)
    case "profile":
        pprof.Profile(c.Ctx.ResponseWriter, c.Ctx.Request)
    case "symbol":
        pprof.Symbol(c.Ctx.ResponseWriter, c.Ctx.Request)
    }
    c.Ctx.ResponseWriter.WriteHeader(200)
}
Here we expose pprof funtions by using beego controller, when we call this API, it will run the analytics.
- Add this controller to router:
package routers

import (
    "controllers/analyze"
)

func init() {
    // other codes

    beego.Router("/debug/home", &analyze.ProfController{})
    beego.Router("/debug/:app([\\w]+)", &analyze.ProfController{})
}- Restart the app.
2 Anaylize
- Access url: http://localhost:5000 (change the port to your own), you will see the page like this:
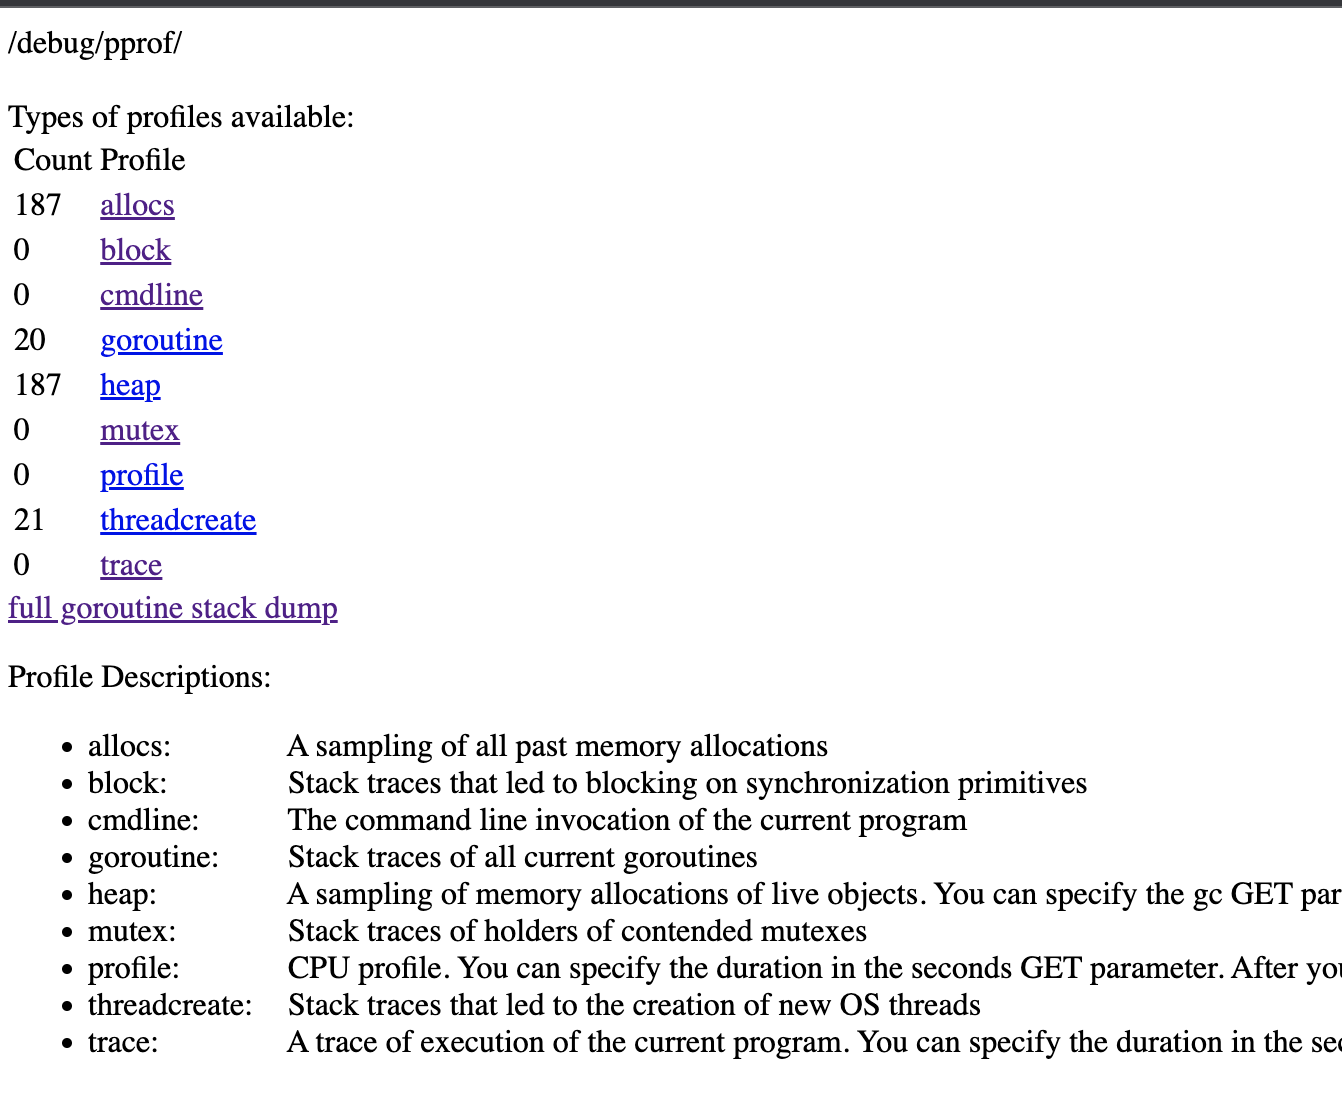
It lists all the functions that Golang pprof provided, to use these functions, we need pprof command come with golang.
-
Type following command on you Terminal to run the analyze, it will automaticlly stop after 30 seconds.
go tool pprof http://localhost:5000/debug/profileThen request your page frequently, or use tools to request automaticlly, e.g. wrk.
-
After 30 seconds, it will entry to
pprofcommand mode, typetop1to see top 10 costs:
(pprof) top
Showing nodes accounting for 6430ms, 66.56% of 9660ms total
Dropped 125 nodes (cum <= 48.30ms)
Showing top 10 nodes out of 125
      flat  flat%   sum%        cum   cum%
    1260ms 13.04% 13.04%     1260ms 13.04%  runtime.pthread_kill
    1020ms 10.56% 23.60%     1020ms 10.56%  path.(*lazybuf).append (inline)
     860ms  8.90% 32.51%     4990ms 51.66%  github.com/astaxie/beego.(*ControllerRegister).getURL
     780ms  8.07% 40.58%     1860ms 19.25%  path.Clean
     590ms  6.11% 46.69%      590ms  6.11%  runtime.kevent
     510ms  5.28% 51.97%     1230ms 12.73%  runtime.scanobject
     430ms  4.45% 56.42%     1200ms 12.42%  runtime.mallocgc
     370ms  3.83% 60.25%      370ms  3.83%  runtime.pthread_cond_wait
     360ms  3.73% 63.98%      360ms  3.73%  runtime.memmove
     250ms  2.59% 66.56%     3580ms 37.06%  path.Join
To understand the difference between flat, flat%, sum%, cum and cum%, please refer: Pprof and golang – how to interpret a results?.
Obviously, here the top 3 flat cost is on runtime.pthread_kill, then path.(*lazybuf).append (inline) and github.com/astaxie/beego.(*ControllerRegister).getURL.
And, top 1 cum is github.com/astaxie/beego.(*ControllerRegister).getURL.
- Type
list getURL, we will see the detail of the code and it’s time cost.
(pprof) list getURL
Total: 9.66s
ROUTINE ======================== github.com/astaxie/beego.(*ControllerRegister).getURL in /Users/gary/works/novel/vendor/github.com/astaxie/beego/router.go
     860ms     11.80s (flat, cum) 122.15% of Total
         .          .    552:       }
         .          .    553:   }
         .          .    554:   return ""
         .          .    555:}
         .          .    556:
      10ms       10ms    557:func (p *ControllerRegister) getURL(t *Tree, url, controllerName, methodName string, params map[string]string, httpMethod string) (bool, string) {
     110ms      110ms    558:   for _, subtree := range t.fixrouters {
     150ms      880ms    559:       u := path.Join(url, subtree.prefix)
      30ms      4.99s    560:       ok, u := p.getURL(subtree, u, controllerName, methodName, params, httpMethod)
         .          .    561:       if ok {
      10ms       10ms    562:           return ok, u
         .          .    563:       }
         .          .    564:   }
      40ms       40ms    565:   if t.wildcard != nil {
         .      830ms    566:       u := path.Join(url, urlPlaceholder)
      20ms      1.87s    567:       ok, u := p.getURL(t.wildcard, u, controllerName, methodName, params, httpMethod)
         .          .    568:       if ok {
         .          .    569:           return ok, u
         .          .    570:       }
         .          .    571:   }
      60ms       60ms    572:   for _, l := range t.leaves {
     310ms      310ms    573:       if c, ok := l.runObject.(*ControllerInfo); ok {
      50ms       50ms    574:           if c.routerType == routerTypeBeego &&
      50ms      2.61s    575:               strings.HasSuffix(path.Join(c.controllerType.PkgPath(), c.controllerType.Name()), controllerName) {
         .          .    576:               find := false
Here we can see, getURL may call itself recursely, and strings.HasSuffix take lots of time.
Which means for us is:
- We need to optimize
strings.HasSuffix - or, do not use getURL that provied by Beego.
3 More
- To see the call stack on browser, type
webinpprofcommand line. - To analyze a local file, use
go tool pprof /Users/gary/pprof/pprof.samples.cpu.001.pb.gz
References: